| Guideline: Guideline On Root Cause Analysis Techniques |
 |
|
| Related Elements |
|---|
Overview Root Cause Analysis (RCA) involves application of a series of problem solving methods used to identify the root causes of problems or issues. These techniques produce a systematic, quantified and documented approach to the identification, understanding and resolution of the underlying cause. By implementing the corrective measures of the root causes, the likelihood of problem recurrence is minimized. However, it is recognized that complete prevention of recurrence by a single intervention is not always possible. Thus, RCA is often considered to be an iterative process, and is frequently viewed as a tool of continuous improvement. While performing root cause analysis (RCA), all possible causes are captured by using techniques like Brainstorming, Cause Effect Diagram / Ishikawa Diagram, etc. Once captured, the irrelevant causes are eliminated. If the identified possible causes are minimal (1 or 2), then the “5 Why” technique is used to arrive at the root cause. In case the possible relevant causes are > 2, then pareto analysis should be performed to arrive at the root cause. The root cause and the actions to eliminate them must be documented. A cost benefit analysis must be performed to verify if the actions are feasible or justifiable. If there is a cost benefit seen, then the corrective action should be implemented. Thus, conducting a Root Cause Analysis gives the confidence that the problem can be solved by taking a structured approach, thereby preventing the recurrence of the problem. Root Cause Analysis Tools And Techniques There are a number of techniques that can be implemented for root cause analysis. The most common ones are described below. Five Whys 5 Why’s typically refers to the practice of asking, five times, why the failure has occurred in order to get the root cause of the problem. Repeat asking “Why” until the root cause is reached. This may be more or less than five whys. No special process is required to apply this technique and the results are mostly captured in a spreadsheet. 5 Why’s are best used when tackling simple RCA. Although a generally accepted technique, few drawbacks of this technique include:
Pareto Analysis Pareto Analysis is a statistical technique in decision-making used to select a limited number of tasks that produce significant overall effect. It uses the Pareto Principle (also known as the 80/20 rule) the idea that by doing 20% of the work you can generate 80% of the benefit of doing the entire job. In this context, this analysis implicates 80 percent of the problems may be caused by as few as 20 percent of causes. To use pareto analysis, identify and list problems and their causes. Then score each problem and group them together by their cause. Here are the 8 points to consider while plotting a Pareto Chart:
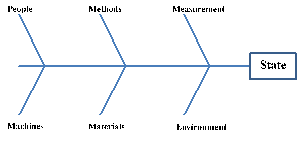
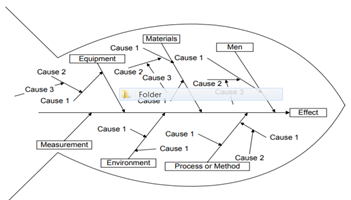
Cause and Effect Diagrams Cause and Effect diagrams (also called Ishikawa diagrams or fishbone diagrams) are a technique to graphically identify and organize many possible causes of an issue. Possible causes are grouped into major categories to identify the sources of the underlying cause. These are then narrowed down to sub causes which need to be addressed. These diagrams help teams to identify the most likely cause of the problem. Cause-and-effect diagrams are designed to:
Causes can be derived from brainstorming sessions using the following steps.
Note: these categories may not fit every situation and different categories might be appropriate. However, the total number of categories should not exceed six.
Cost Benefit Analysis A Cost-Benefit Analysis (CBA) is a process by which business decisions are analyzed. It is a systematic approach to estimate the strengths and weaknesses of alternatives. It is used to determine options that provide the best approach to achieve benefits while preserving savings The CBA is also defined as a systematic process for calculating and comparing benefits and costs of a decision. CBA has two main purposes:
Following are the steps involved in performing a Cost Benefit Analysis:
|